How It Works
1
Upload
Upload your CSV file to Storytell. For detailed instructions on uploading content, see our Uploading Content guide.
2
Processing
Storytell processes the first 2,000 rows of the CSV file
3
AI Analysis
Storytell LLM analyzes the Chunks.
4
Insight Extraction
Query your data using SmartChat™.
Generating Chunks
Chunks are clusters of related concepts from your data. For example, let’s say you have a CSV file with the following information:| Name | Composition | Distance from the Sun (AU) | Orbital Period (years) | Diameter (km) |
|---|---|---|---|---|
| Mercury | Rocky | 0.39 | 0.24 | 4879 |
| Venus | Rocky | 0.72 | 0.62 | 12104 |
| Earth | Rocky | 1 | 1 | 12742 |
| Mars | Rocky | 1.52 | 1.88 | 6779 |
| Jupiter | Gas Giant | 5.2 | 11.86 | 139820 |
| Saturn | Gas Giant | 9.58 | 29.46 | 116460 |
| Uranus | Ice Giant | 19.22 | 84.01 | 50724 |
| Neptune | Ice Giant | 30.05 | 164.79 | 49244 |
| Moon | Rocky | N/A | 0.074 | 3474 |
| Titan | Icy | N/A | 15.94 | 5149 |
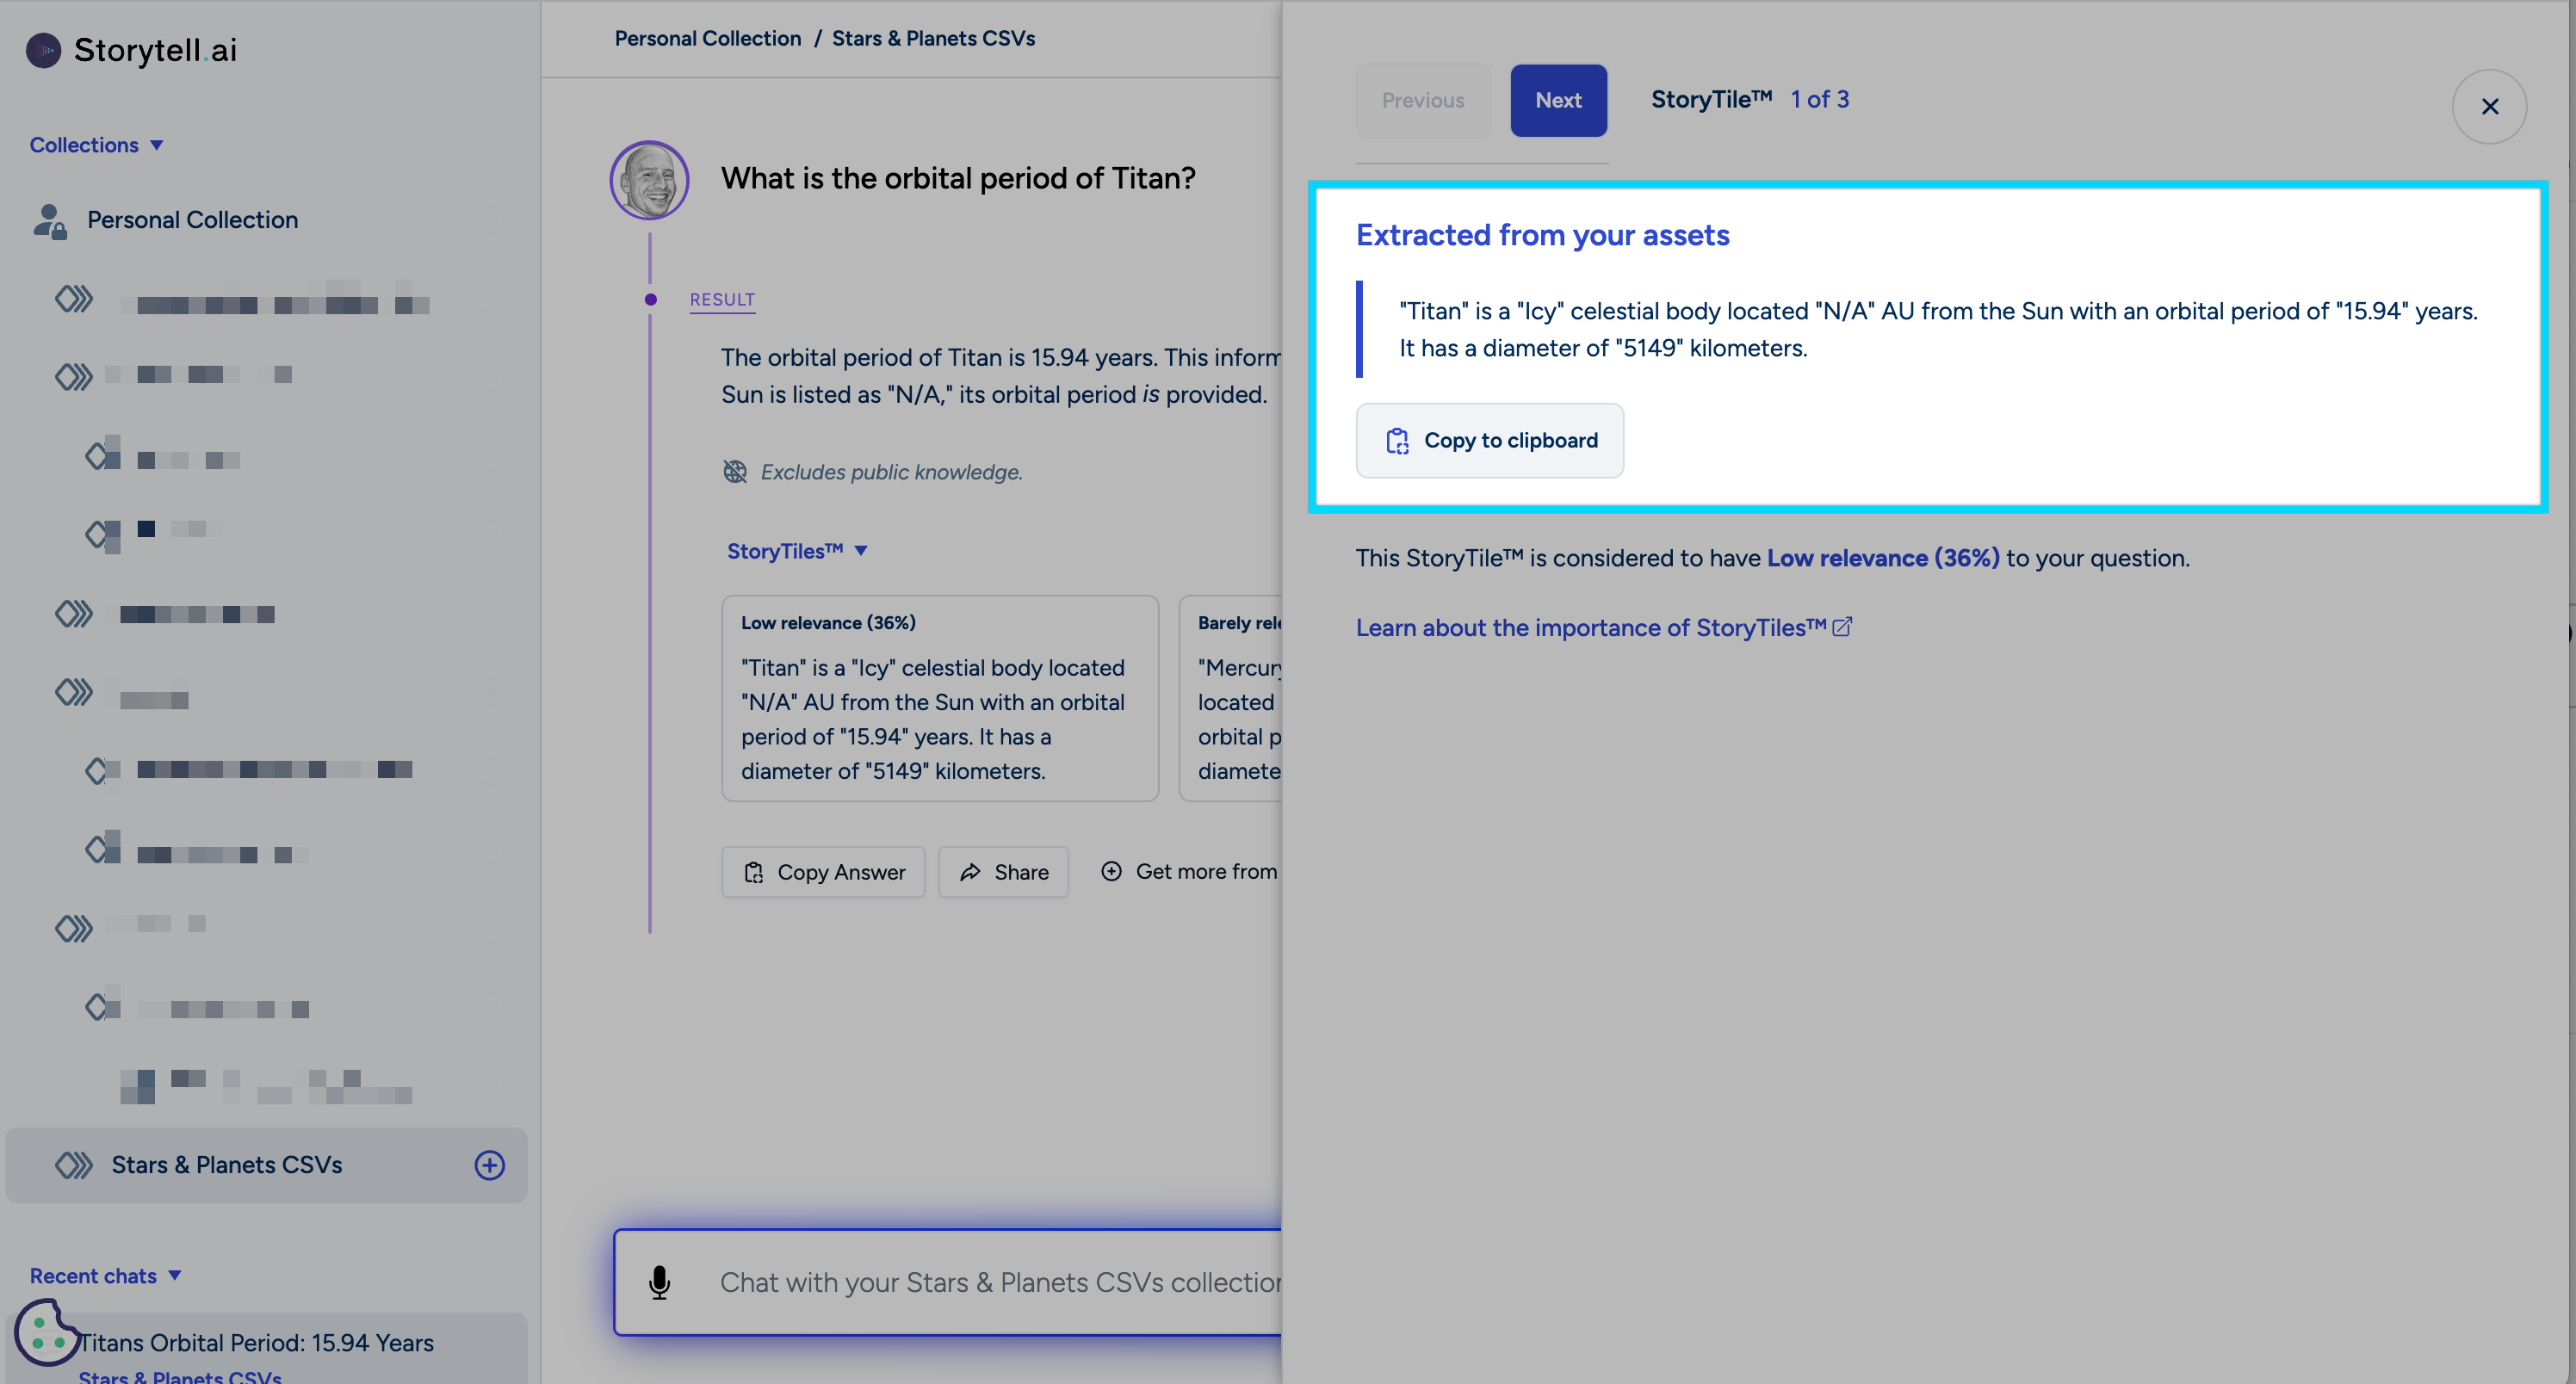
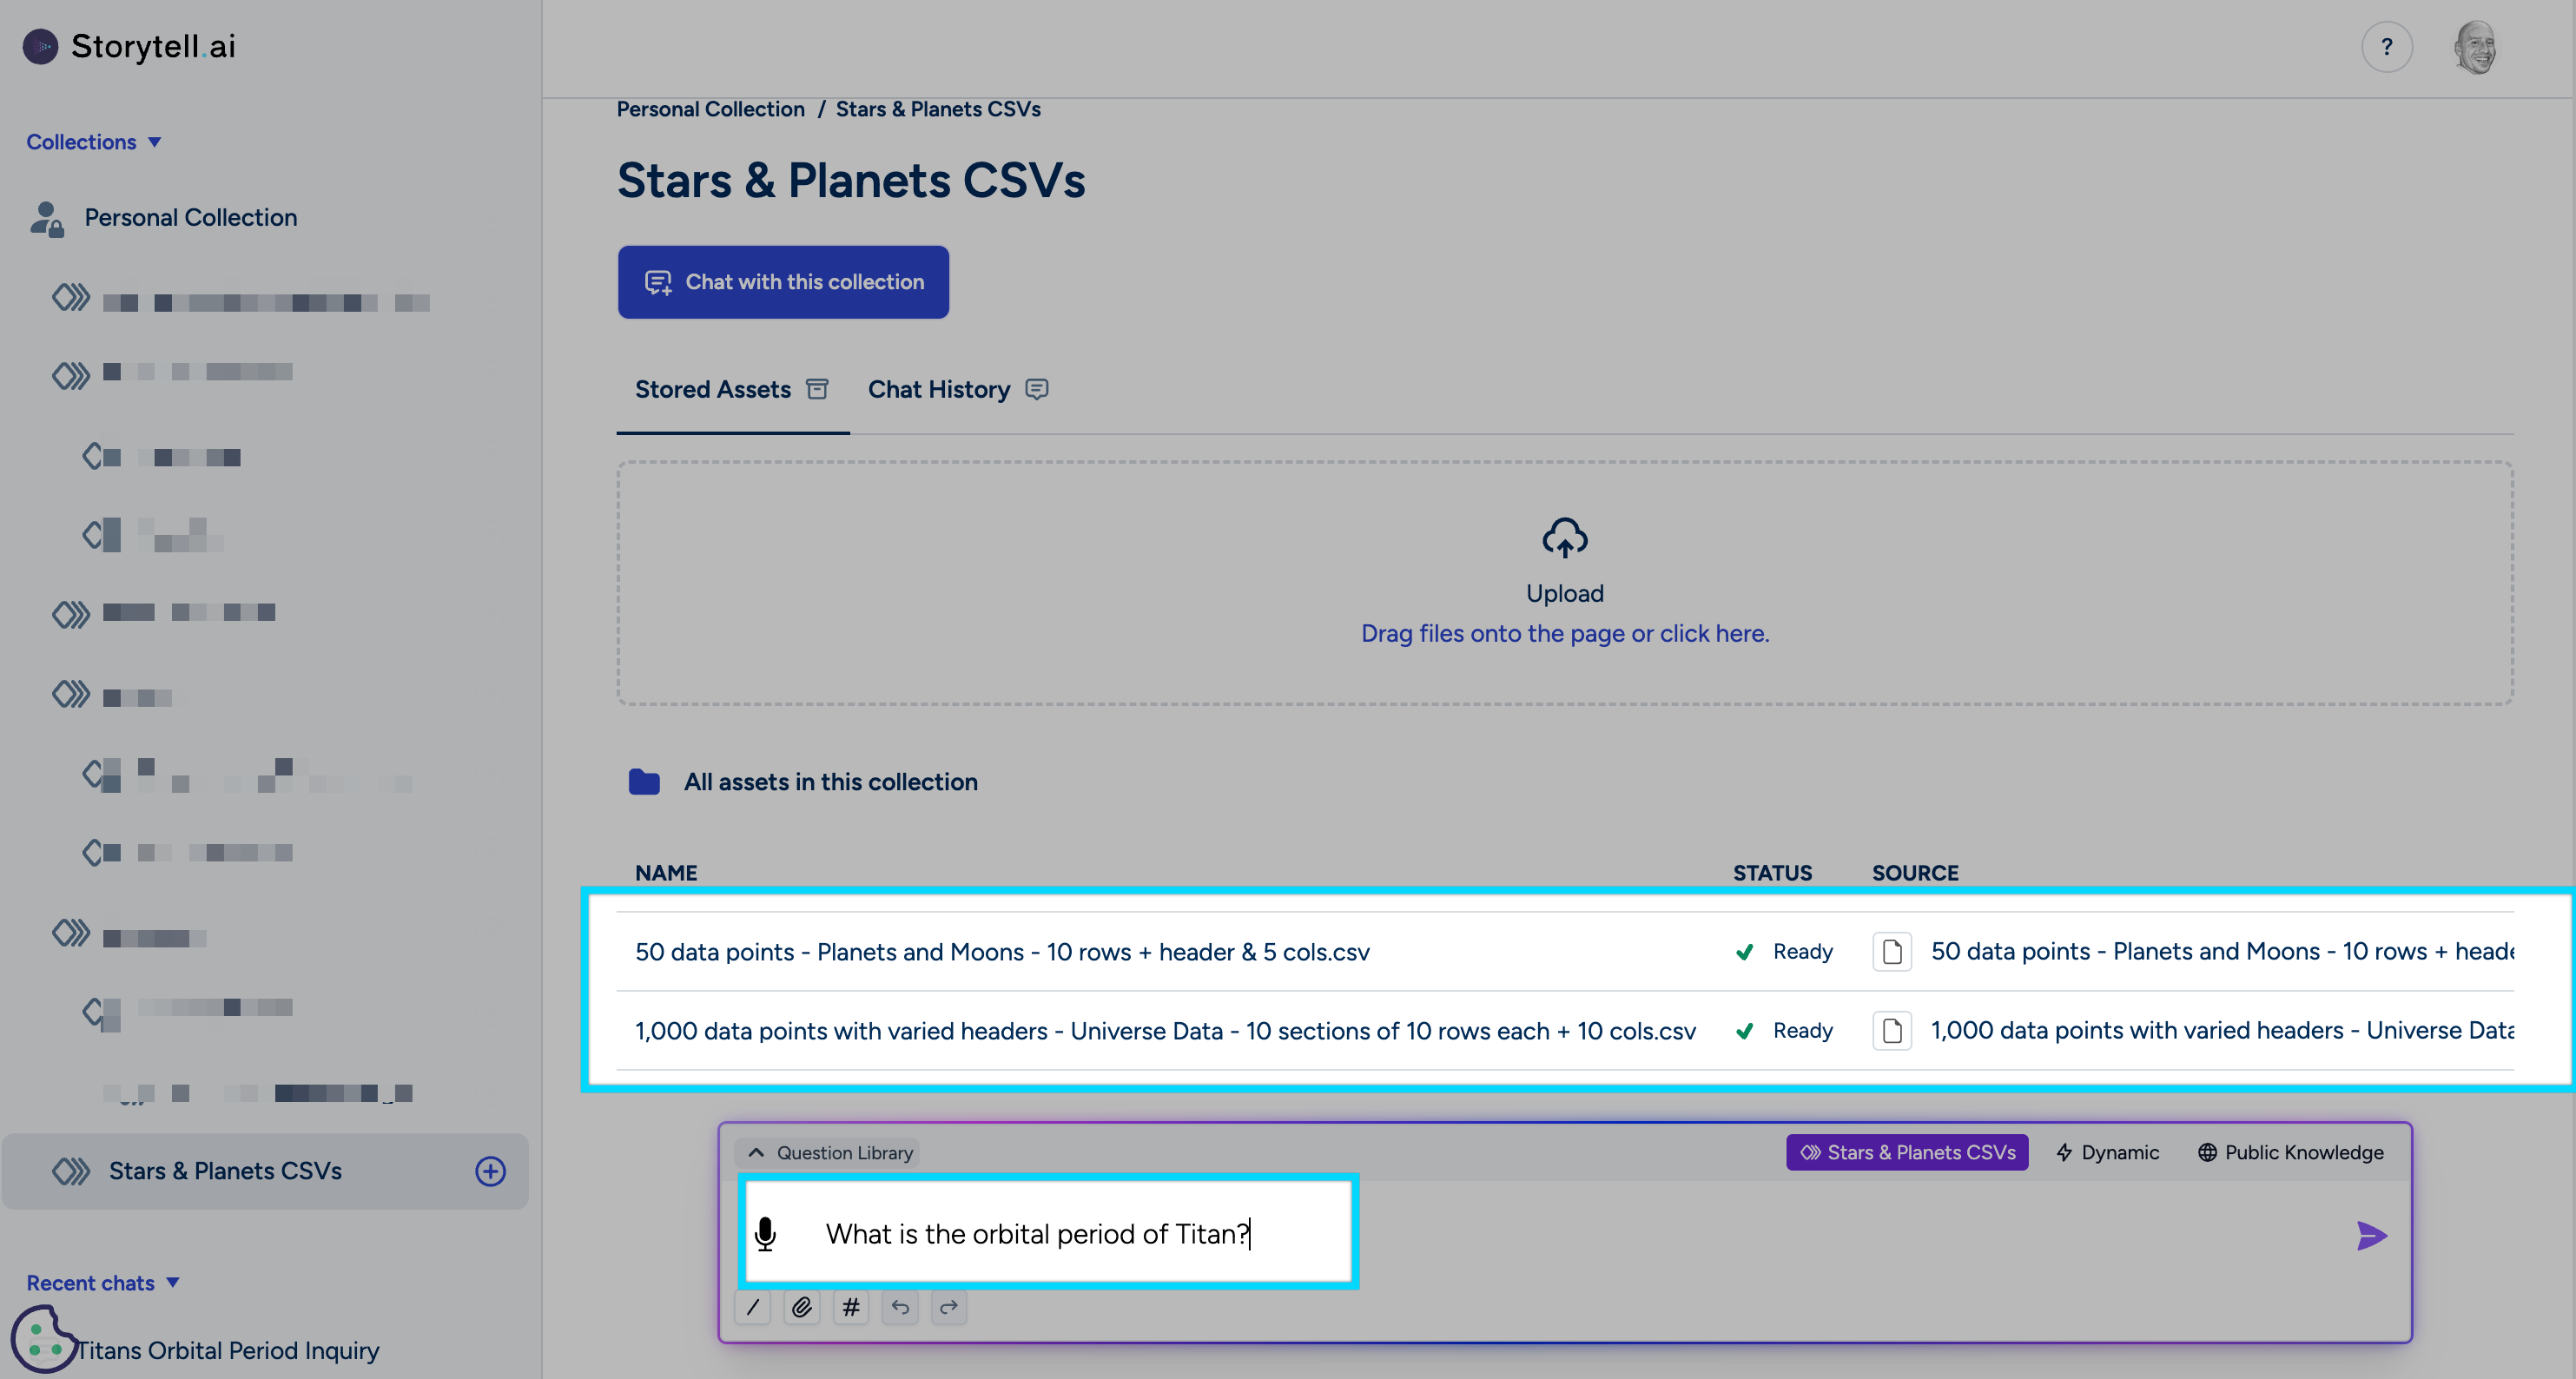
Querying Your Data
With Storytell, you can ask questions about your CSV data and receive clear, insightful answers through SmartChat™: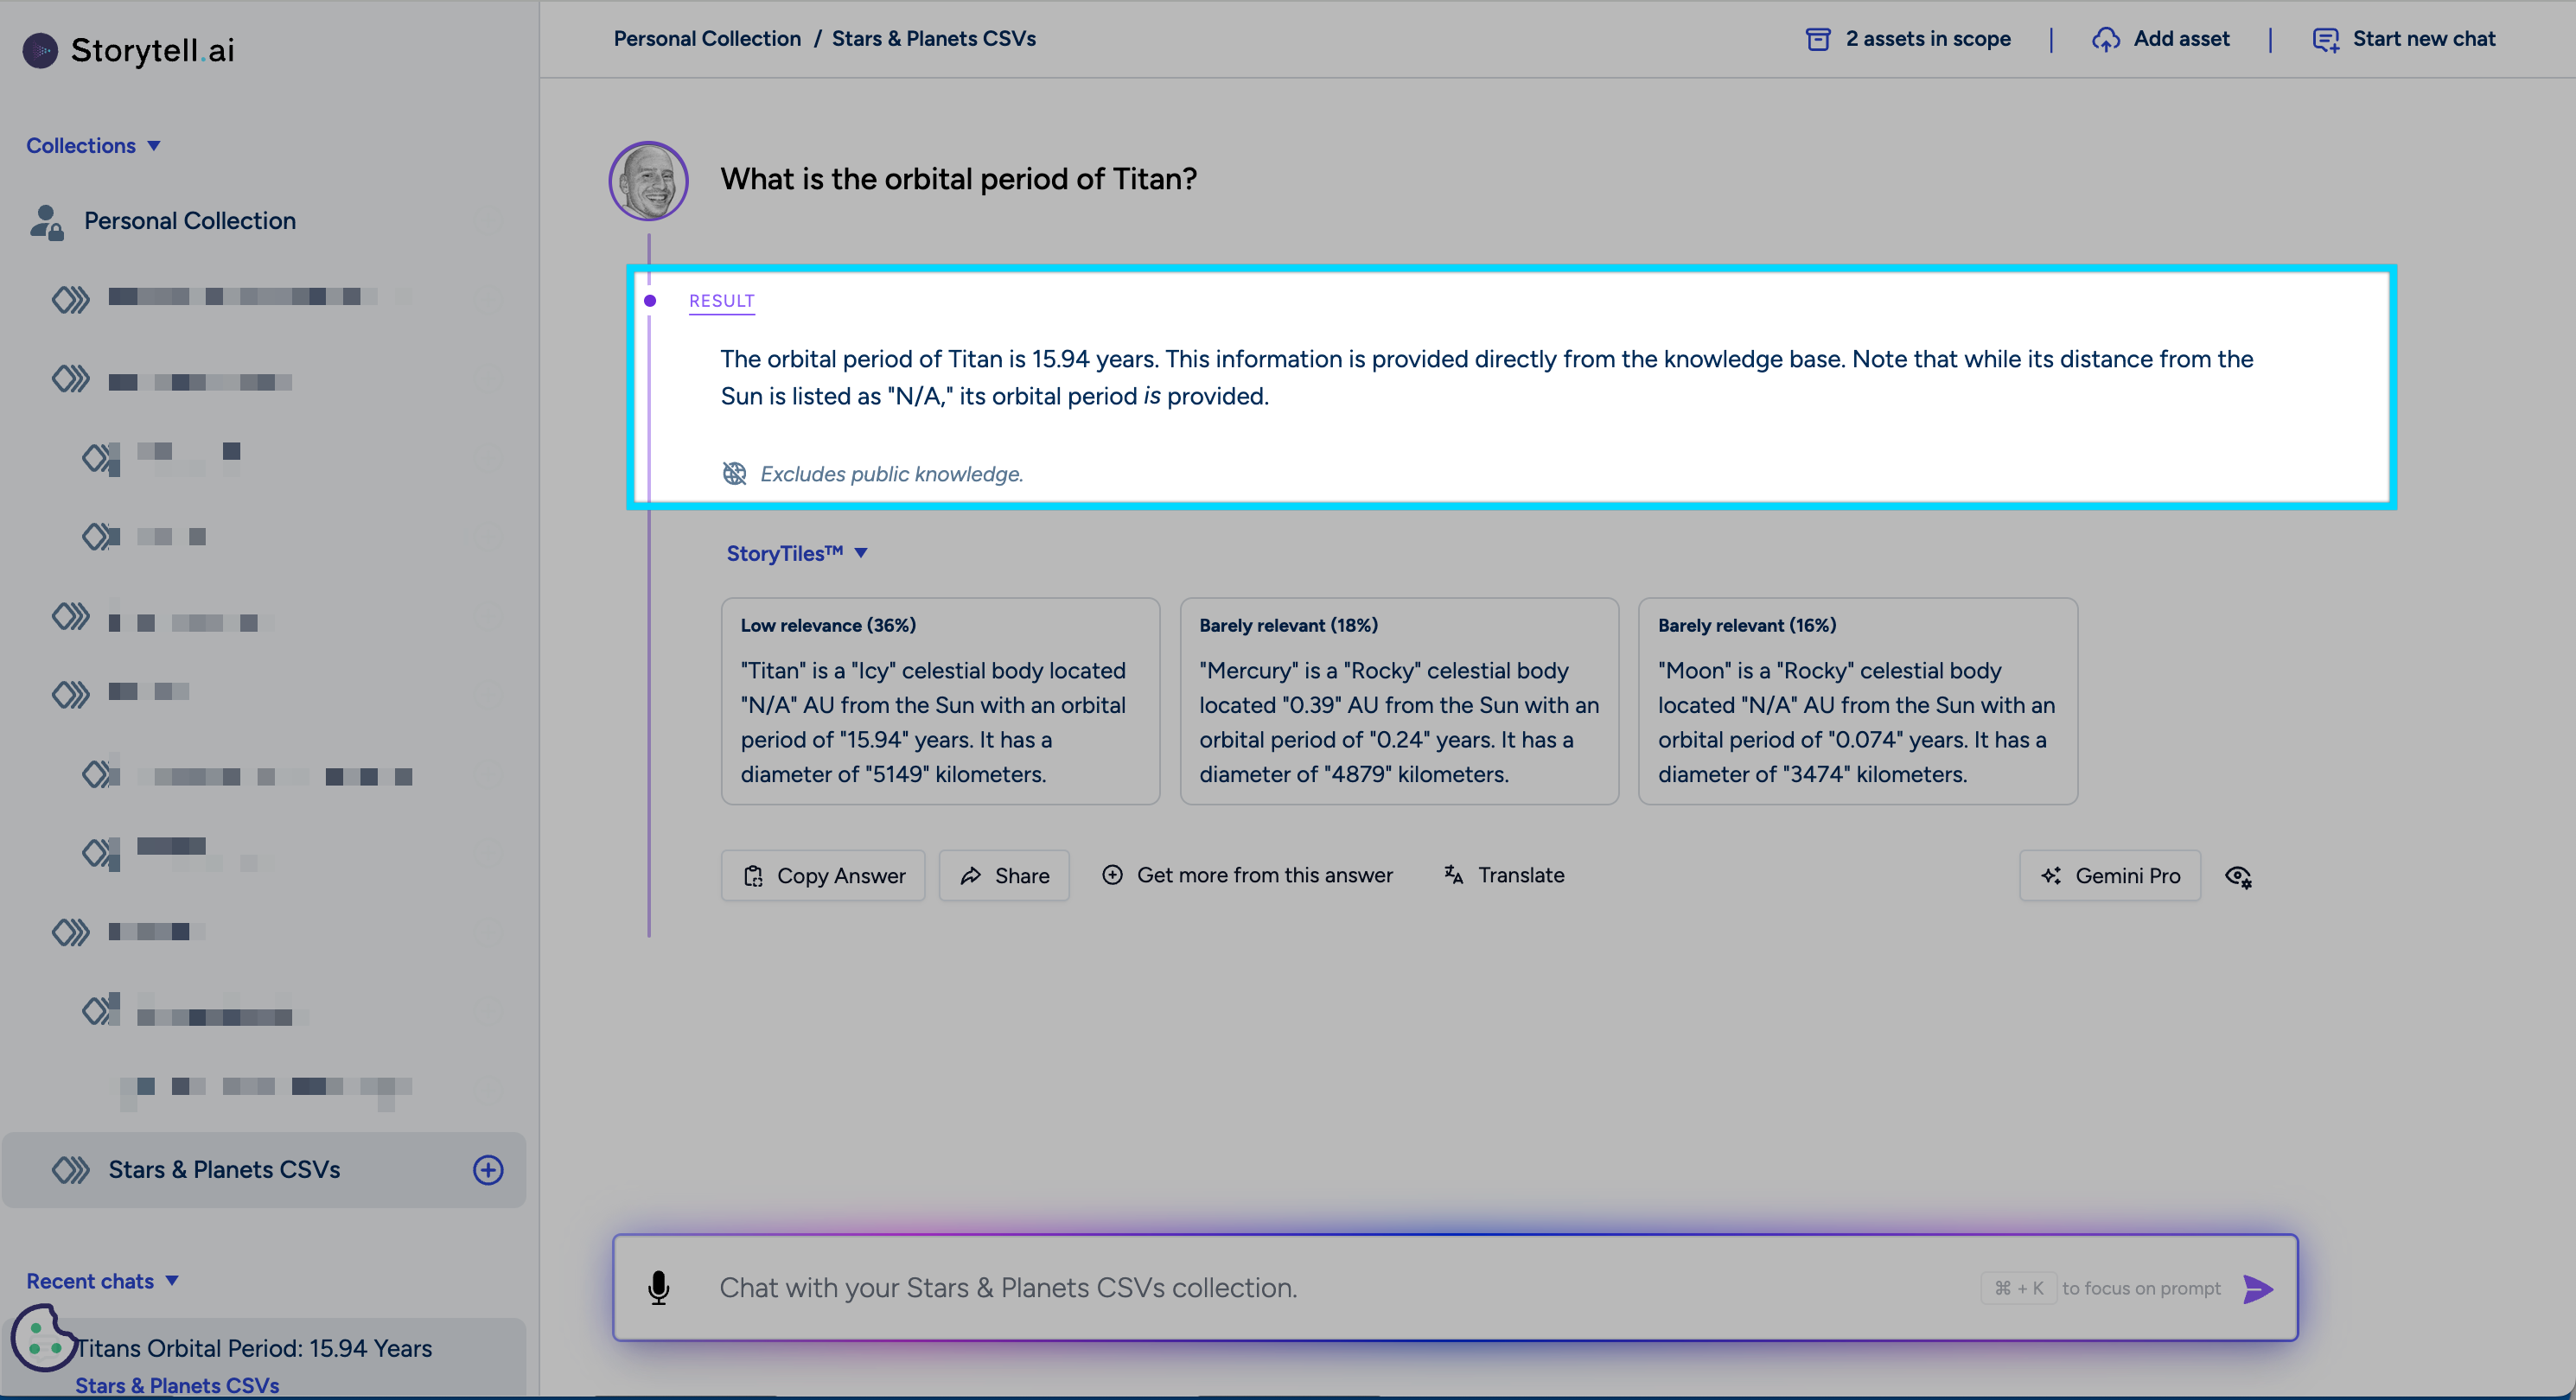
Verifying Accuracy
Storytell’s responses are based on the data you provide. You can always verify the information by checking the original CSV file: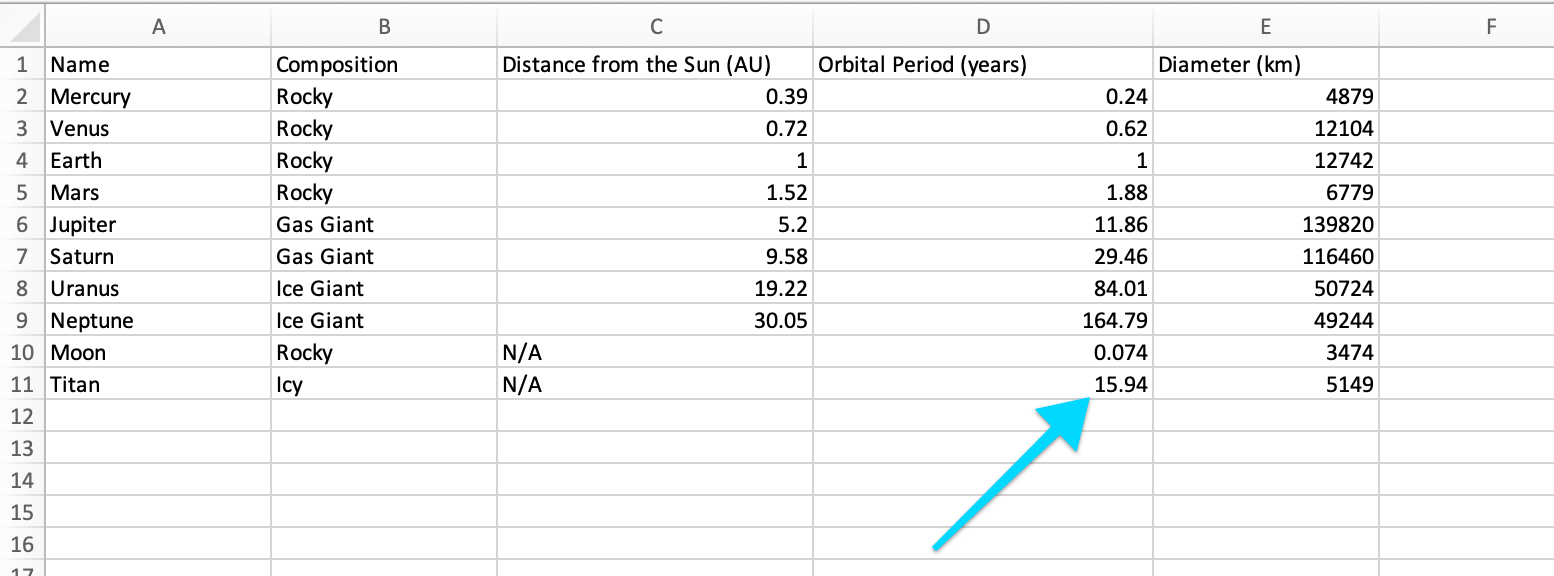
Technical Considerations
- Processing limited to first 2,000 rows for speed and efficiency
- Secure, isolated environments for data privacy
- Scalable architecture for concurrent processing
Handling Structured vs. Semi-Structured CSV Files
The Storytell process involves classifying CSV file content as either “structured” or “semi-structured” to determine the appropriate processing strategy. This classification is crucial for handling CSV files that do not conform to traditional tabular formats, ensuring that data is processed accurately and efficiently.Structured vs. Semi-Structured Data
Structured Data Structured data in CSV files typically includes a clear header row followed by consistent data rows. Each column represents a specific data attribute, and each row contains data entries corresponding to these attributes. This format is straightforward to process using standard CSV parsing techniques. Semi-Structured Data Semi-structured data, on the other hand, may not have a consistent structure. These CSV files might lack headers, have inconsistent columns, or contain data that resembles reports rather than traditional tables. Such files require a different approach to ensure accurate data extraction and processing.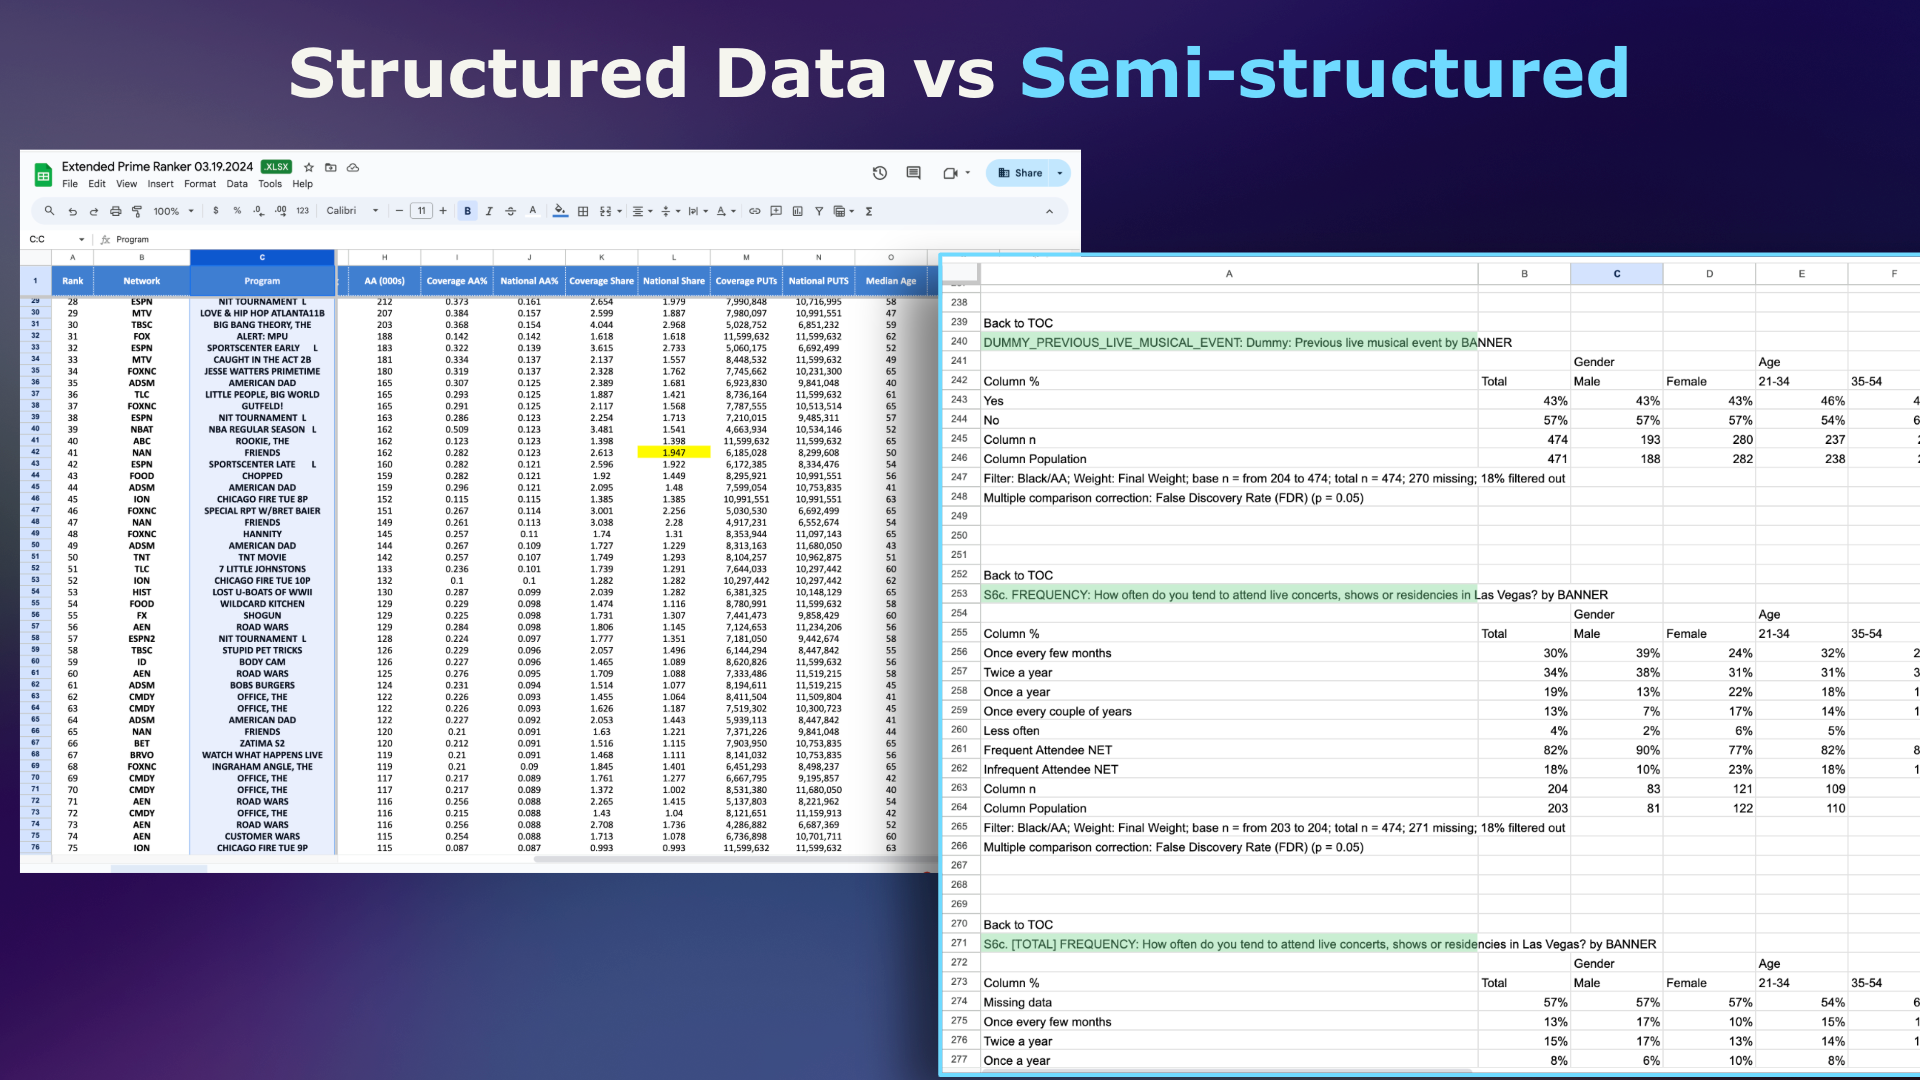
Process for Classifying CSV Content
- Initial Inspection: Storytell begins by automatically inspecting the CSV file. During this phase, the system determines key characteristics, such as the presence of a header row and the consistency of data rows throughout the file.
- Classification:
Based on the results of the initial inspection, Storytell classifies the CSV content into one of two categories:
- Structured: If the CSV file contains a clear header row and all data rows are consistent, it is classified as structured data.
- Semi-Structured: If the file is missing a header or exhibits inconsistent columns, it is classified as semi-structured data.
- Prompt Selection: Based on the classification, Storytell selects the appropriate processing prompts tailored to the content type:
- For structured data, Storytell utilizes standard CSV processing prompts to ensure efficient data handling.
- For semi-structured data, the system employs specialized prompts designed to manage variability and generate data “chunks.” Key considerations include:
- Ensuring that the language model does not drop any data points by refining the prompts.
- Including a “source” identifier in each chunk to enhance data searchability and retrieval.
Multi-Tab XLS Files
Large language models (LLMs) often struggle with interpreting data from multi-tab XLS files due to their reliance on proximity to make sense of information, which can lead to confusion, especially with complex datasets. Storytell addresses this challenge by converting data into a more coherent format.Storytell’s Process for Multi-Tab XLS Files
1. Uploading the File When you upload a multi-tab Excel file into Storytell, the system processes each tab’s data individually. 2. Breaking Down the Data Storytell breaks the uploaded file into discrete pieces of information, analyzing each row and column to identify key concepts and relationships. 3. Creating Chunks After breaking down the data, Storytell converts the rows into Chunks, coherent sentences that represent the information for easy understanding by LLMs. This transformation allows LLMs to provide accurate responses based on the data you’ve uploaded. 4. Interacting with Your Data After uploading your multi-tab Excel file, create a Collection to organize your data. You can then interact with this Collection and ask specific questions. You can reference specific tabs or columns in your prompts by mentioning the tab or column name directly. For example, if you have an Excel file with three tabs named “tacos”, “enchiladas”, and “tostadas”, and a column named “price”, you can ask: Storytell will pull the relevant information from your multi-tab XLS data.

 Learn more about the process by watching DROdio’s video demonstration that highlights its functionality.
Future Enhancements
- Support for larger datasets (beyond 2,000 rows)
- Advanced data type detection and custom Story Tile™ generation