Extract insights from charts, tables, and images with Storytell’s Vision Ingest
Imagine trying to extract key insights from a thousand-page report, but half the critical data is locked inside images, charts, or infographics, rather than plain text. That’s where Storytell Vision Ingest steps in. This powerful capability within Storytell.ai is designed to instantly transform visual data into structured, actionable insights, ensuring that every file you upload—from slide decks to scanned documents—is fully understood, making its content truly query-ready. With Vision Ingest, you no longer risk skipping over crucial visuals or missing pieces of the puzzle. Storytell.ai ensures you get the complete picture.What is Vision Ingest?
Storytell Vision Ingest is an advanced engine built into our platform, specifically designed for visual understanding. Its purpose is to analyze and interpret a wide array of visual elements embedded within your documents, such as charts, graphs, tables, images, and even flags. Unlike traditional Optical Character Recognition (OCR) which simply “reads” or extracts text characters from an image, Vision Ingest goes much further. It perceives and understands the content and context of your visuals. The result is a seamless integration of textual and visual information, processed with precision and delivered in a structured format that’s perfect for search, analysis, and AI-powered queries. The goal is to help users work with unstructured content more effectively by turning visuals into structured, query-ready data.How Does Vision Ingest Work?
Storytell Vision Ingest operates using a sophisticated multi-modal pipeline, which includes a Vision-capable Large Language Model (LLM). This combination allows Storytell to not just see, but comprehend your visual data. Here’s a breakdown of the process:1
Versatile File Upload
You can upload a variety of file types, including PDF, DOCX, PPTX, PNG, JPEG, or WEBP. Vision Ingest handles these mixed formats effortlessly, meaning you don’t need to reformat your files.
2
Smart Auto-Sharding for Large Files
To effectively process large documents, Vision Ingest automatically splits large files into manageable ‘shards’.
3
Visual Interpretation Beyond OCR
The Vision-capable LLM reads and understands your uploaded assets. This means it:
- Describes and interprets elements like charts, tables, and images.
- Can identify data trends in line or bar charts.
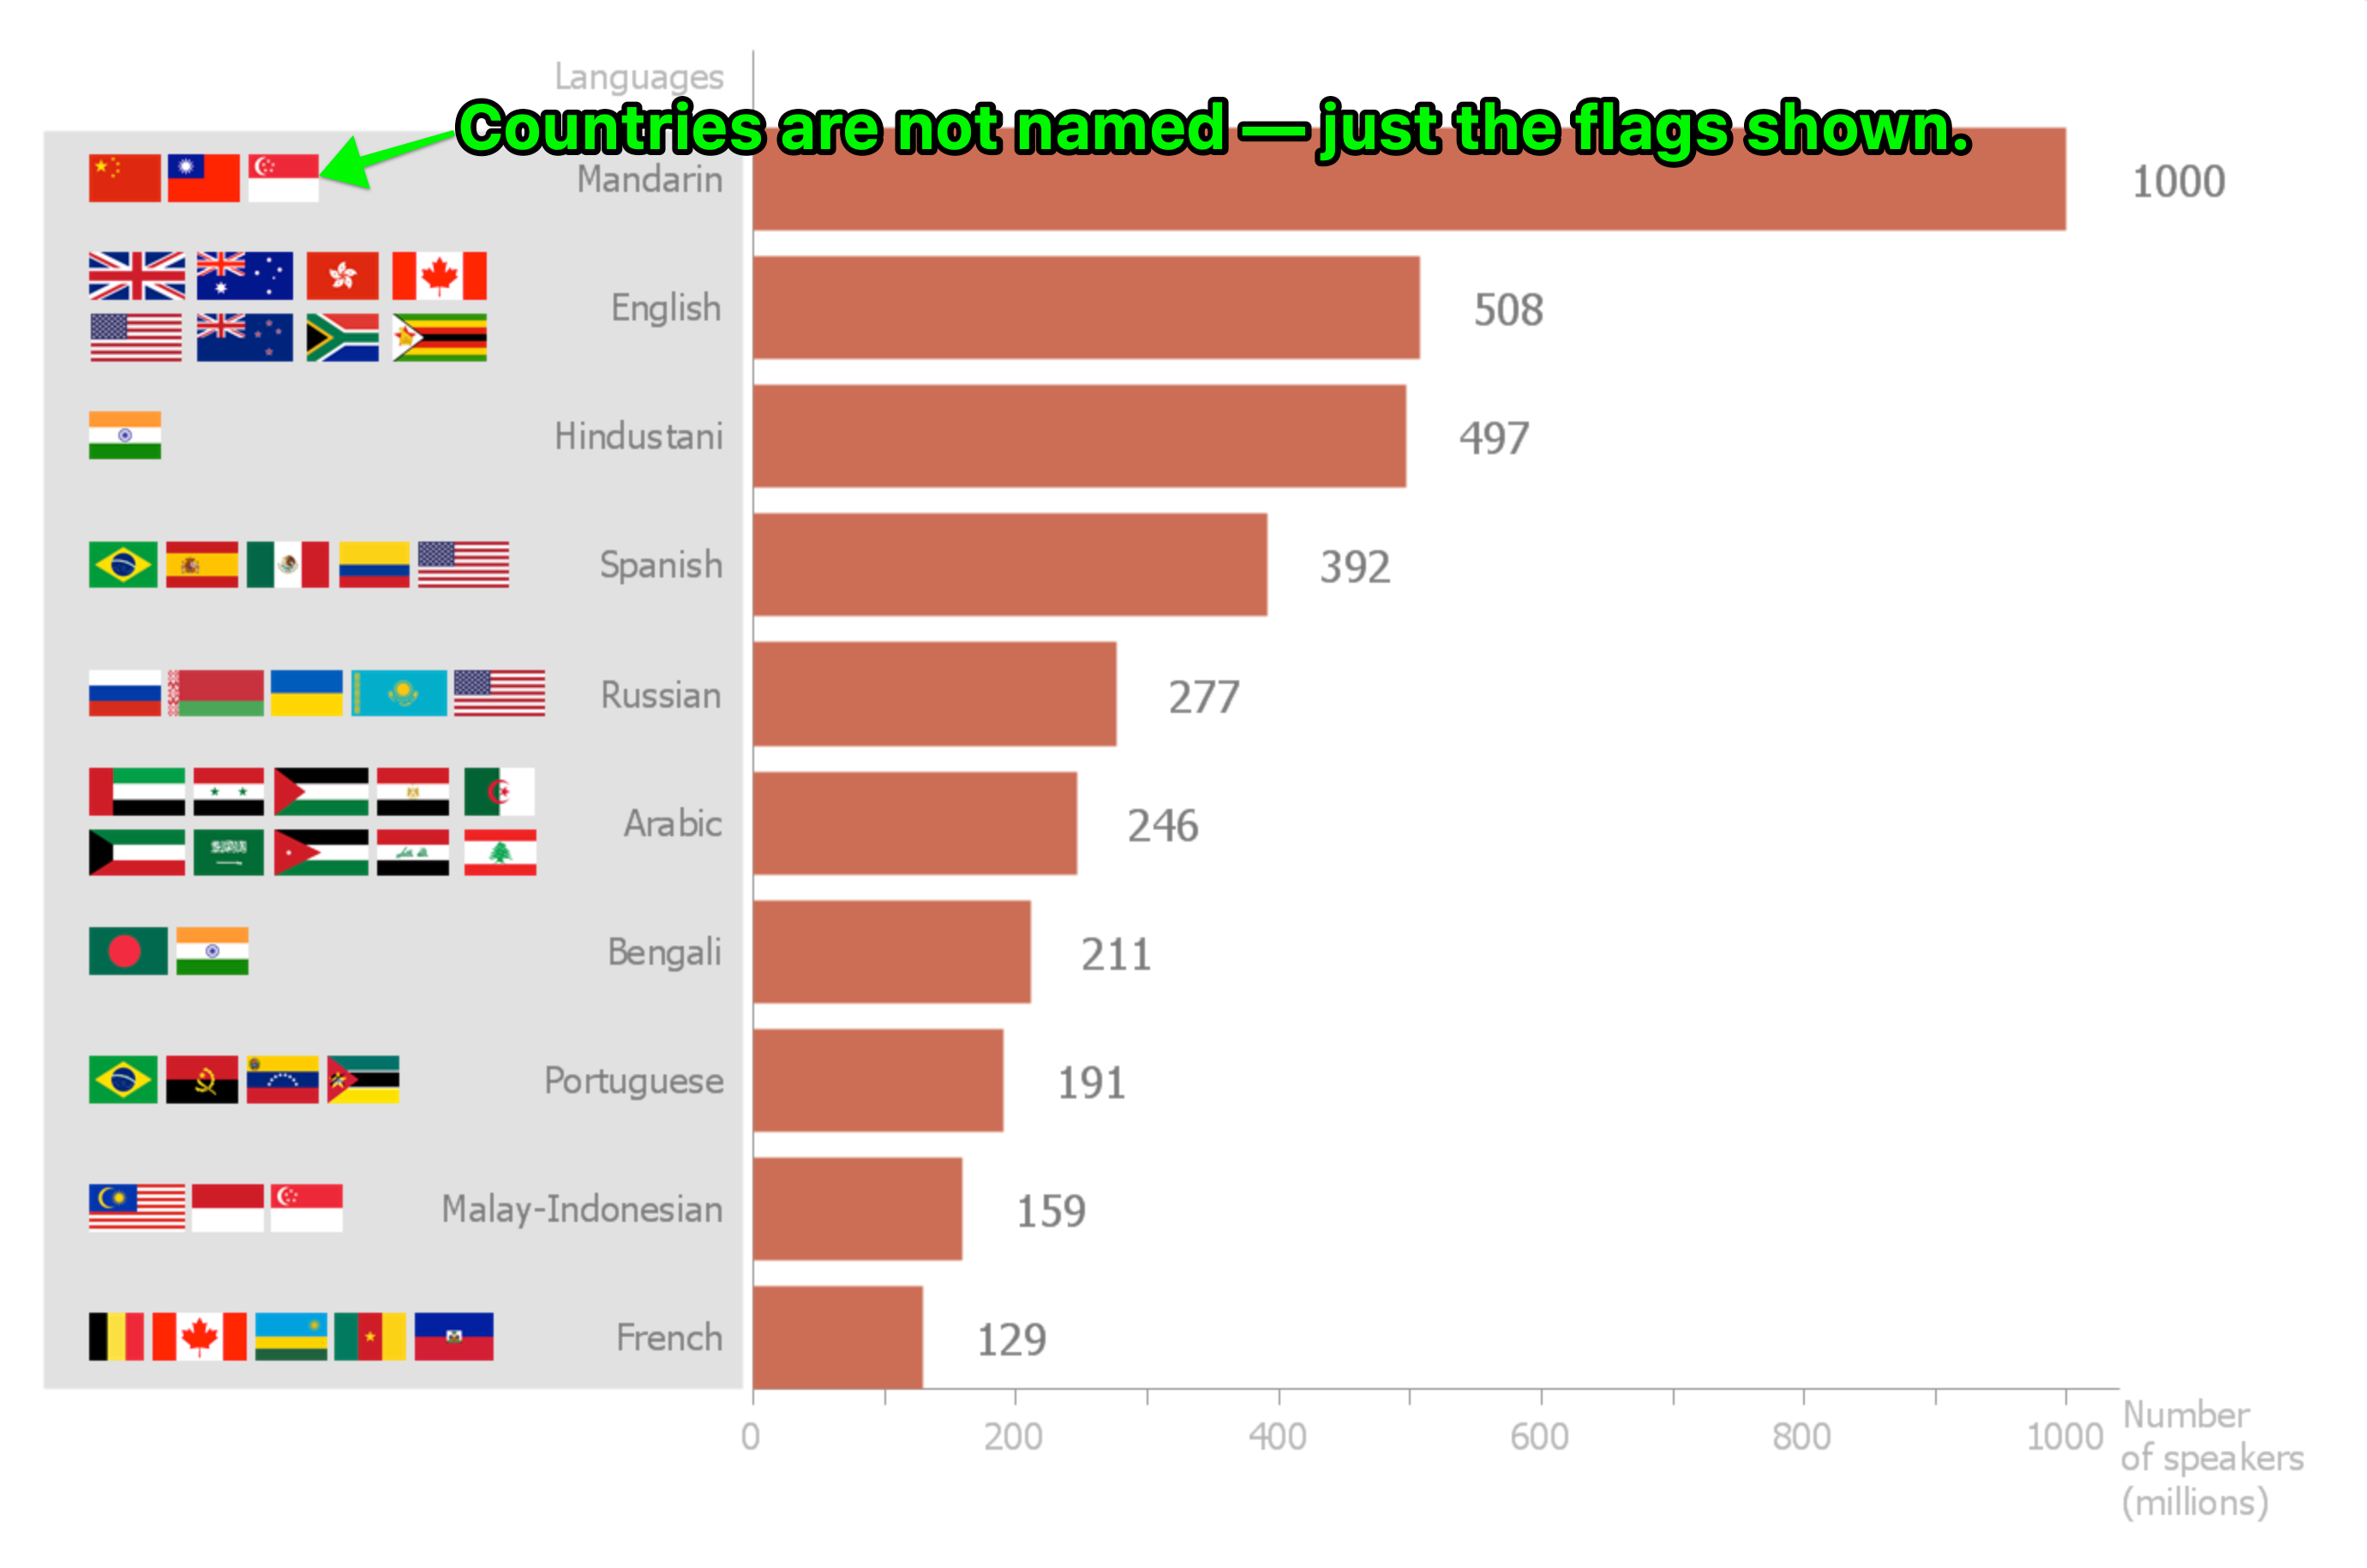
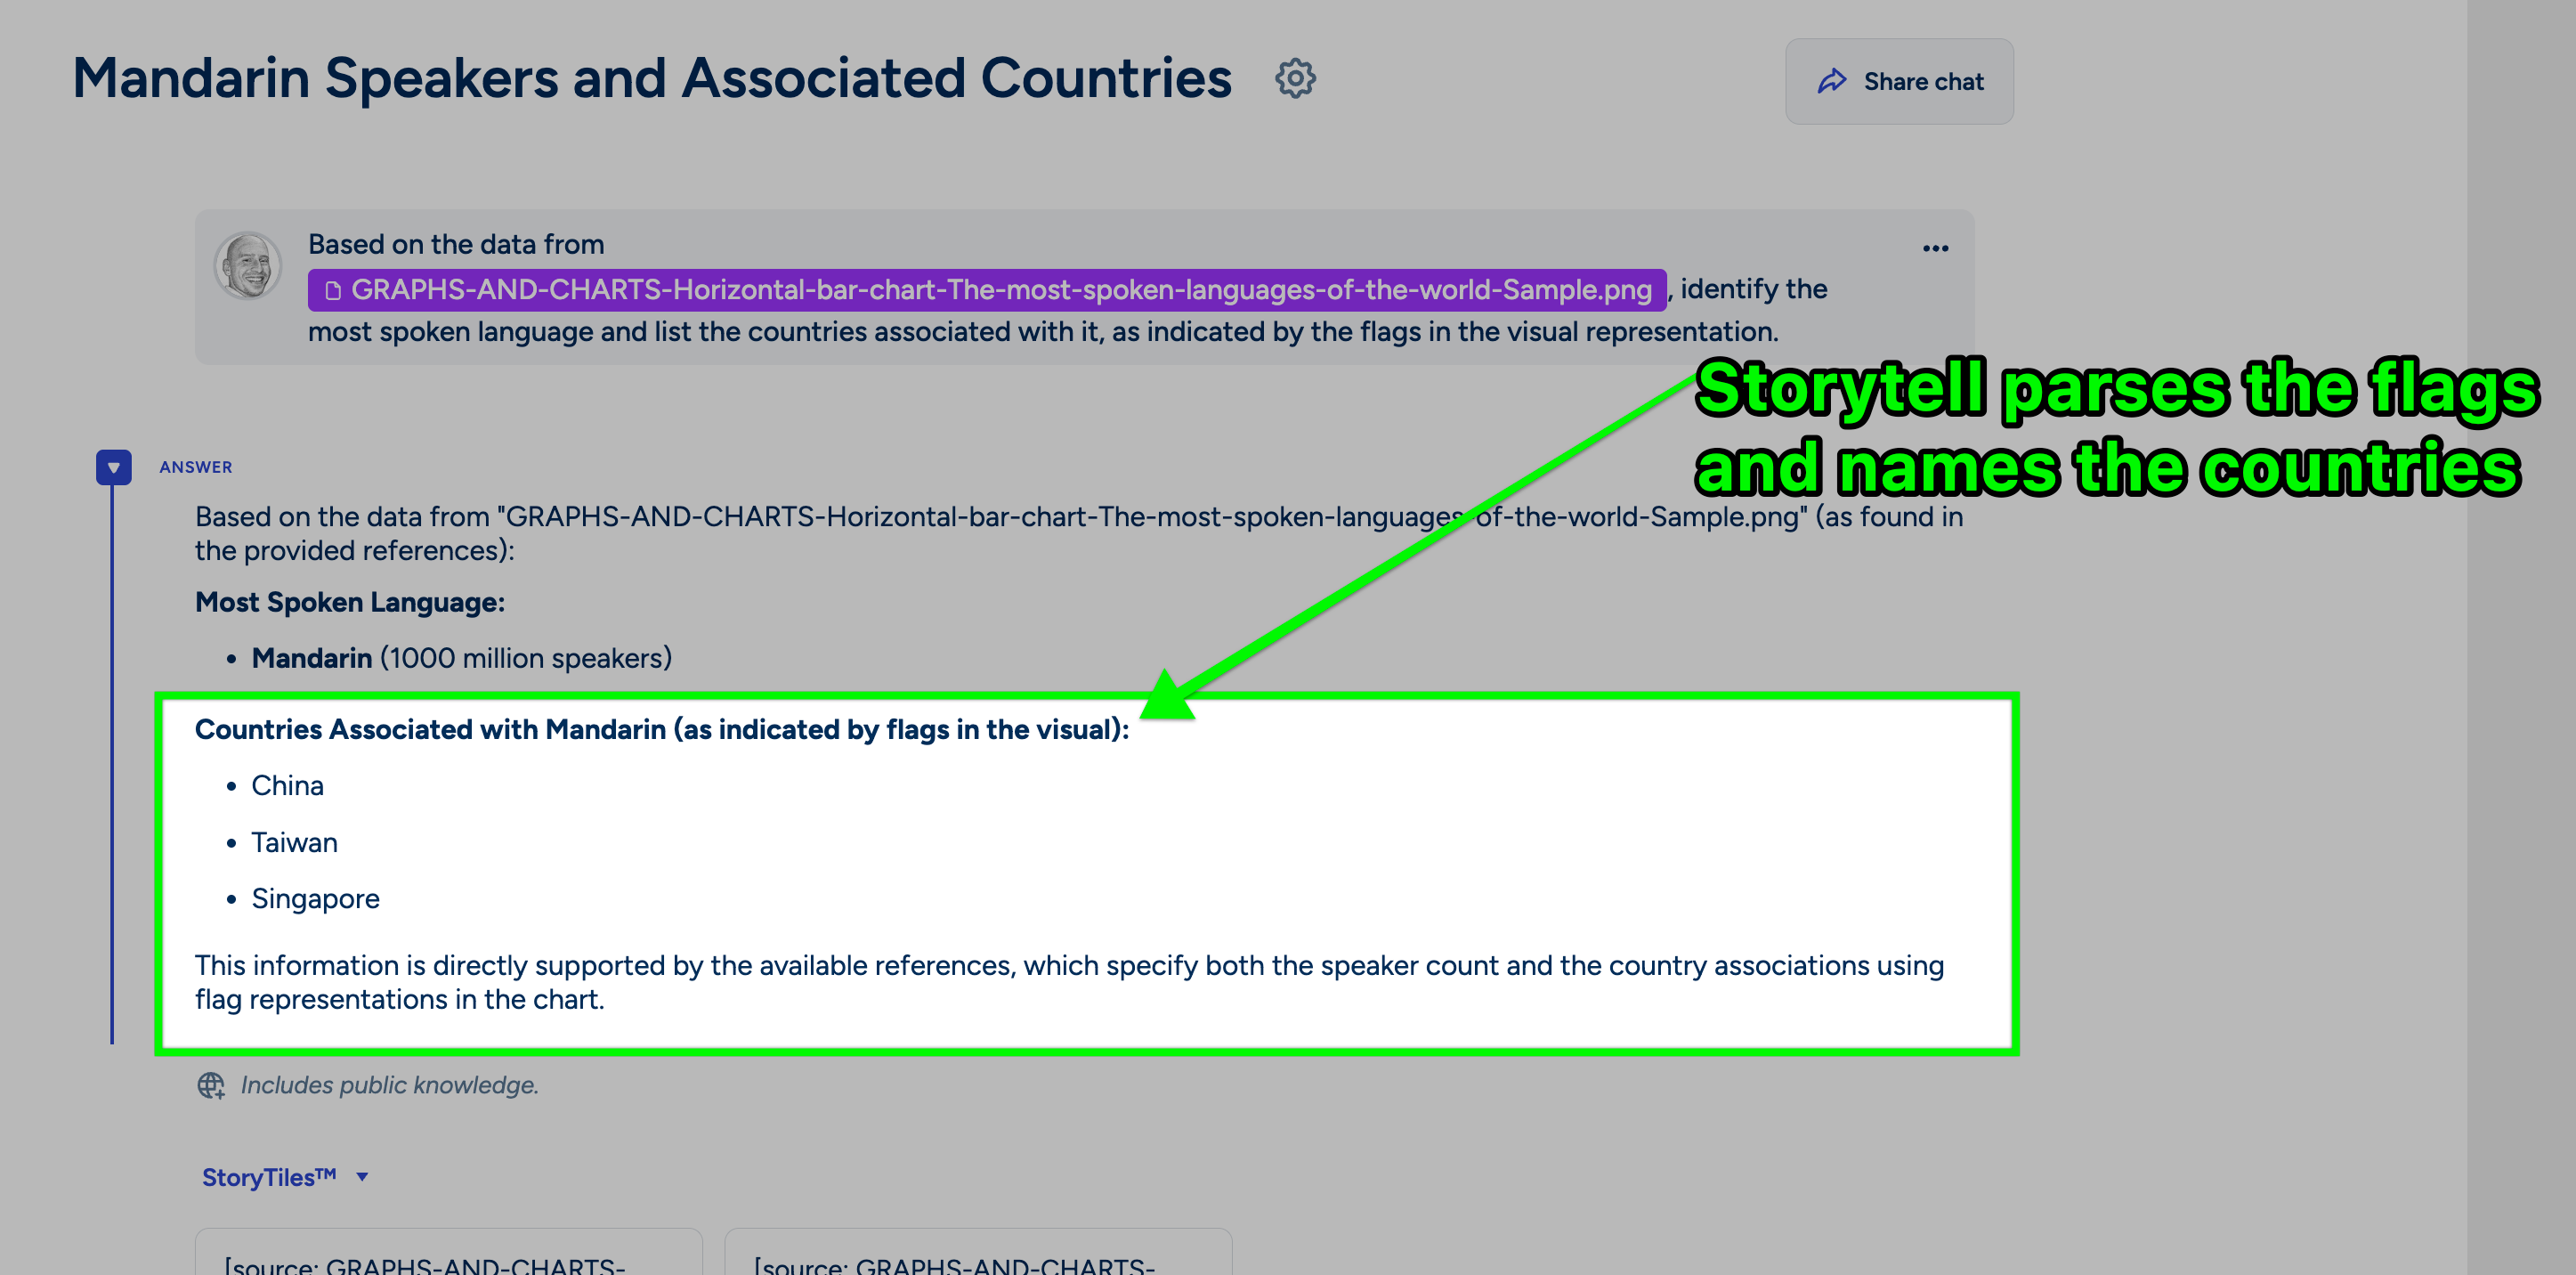
- Can, for example, “understand the flags and find the countries from the flag images.”
4
Structured and Readable Output
The extracted visual information is transformed into markdown or HTML. This markdown-first output strategy is optimized for both human readers and AI querying, ensuring the output is clean, readable, and performs well with LLMs.
Why is Vision Ingest so powerful?
Unlock Hidden Data
Many of the files our users upload include tables, maps, charts, or infographics that carry important information. Vision Ingest ensures this information is no longer skipped, providing a “more complete representation of the file.
Get Clearer Answers
By turning cluttered visuals to clear answers you can confidently ask questions like, “What’s the trend in this line graph?” or “Summarize the slide with the revenue chart.”
Achieve Faster Insights
Benefit from Smarter extraction, cleaner outputs, faster answers as visual data is automatically processed and made ready for querying.
Flexible File Handling
Upload various document and image types without worrying about pre-conversion.
Real-World Examples
Here are a few ways Vision Ingest helps you interact with your visual data:-
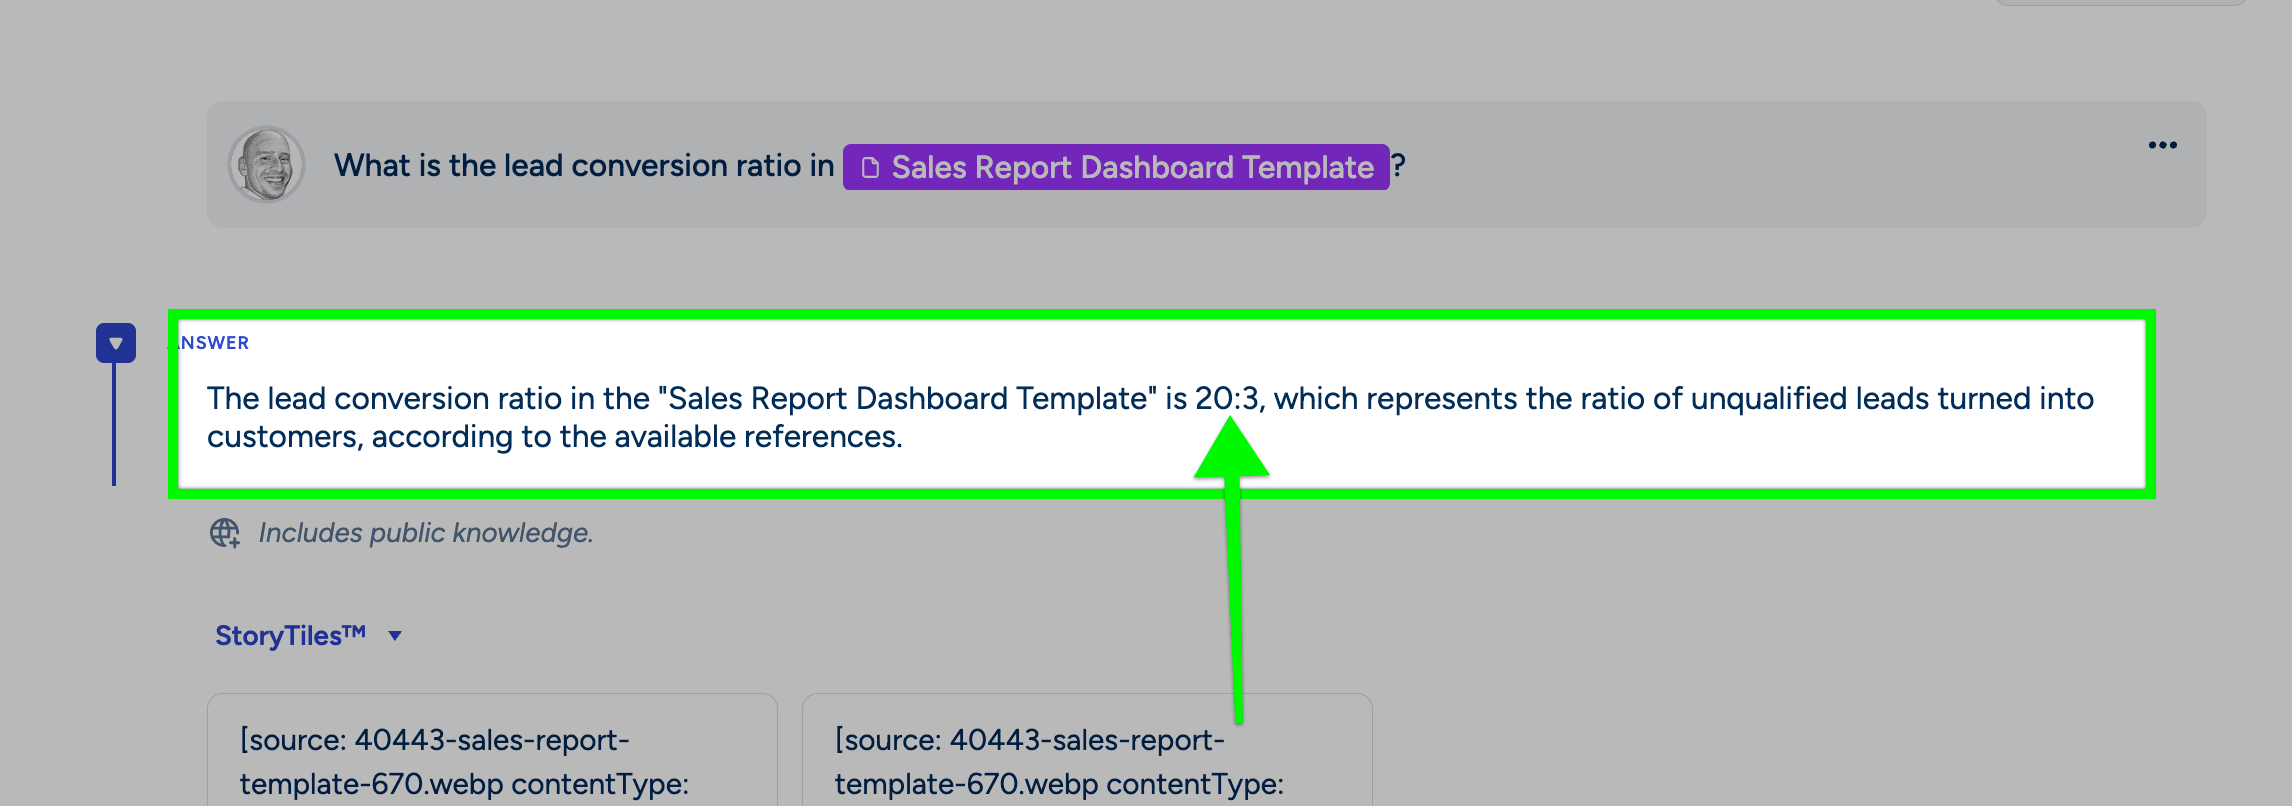
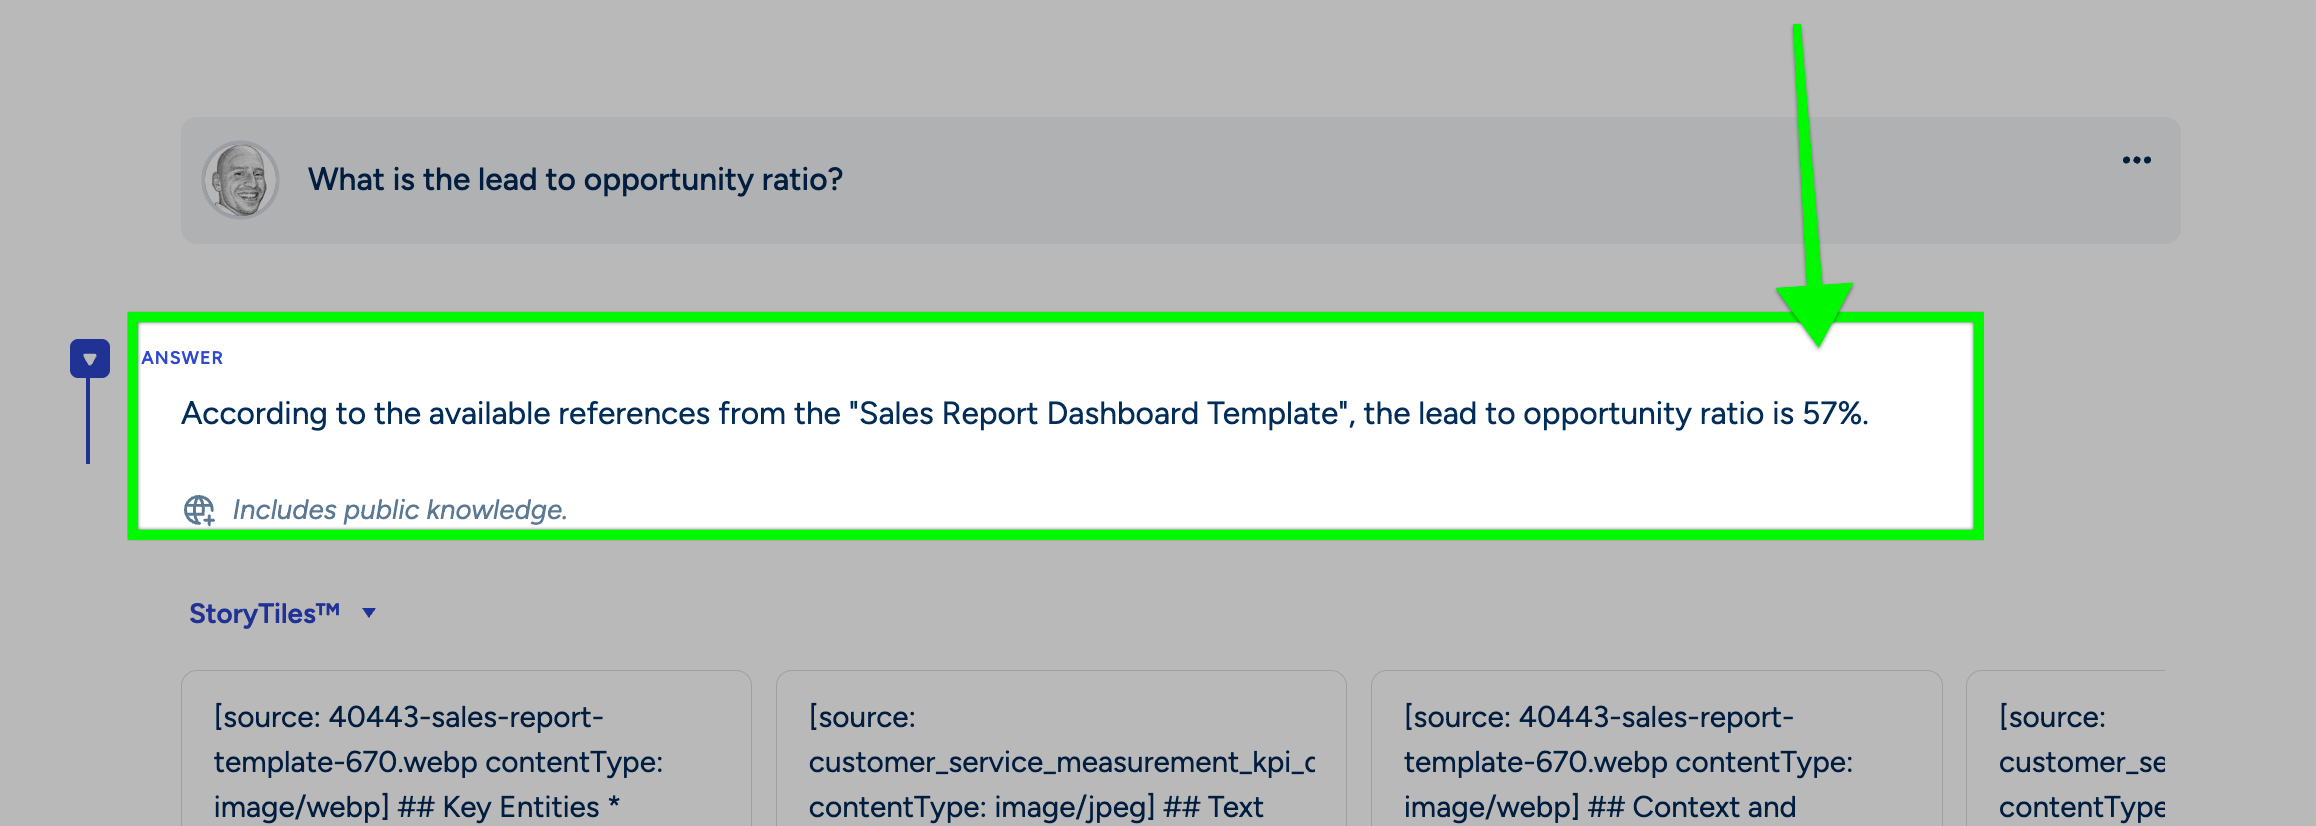
Extracting Key Metrics from Dashboards and Reports: Business documents often contain dense visual information in dashboards or reports. Vision Ingest can process these, whether they are in slide decks, PDFs, or image files. For example, consider the following sales report dashboard:
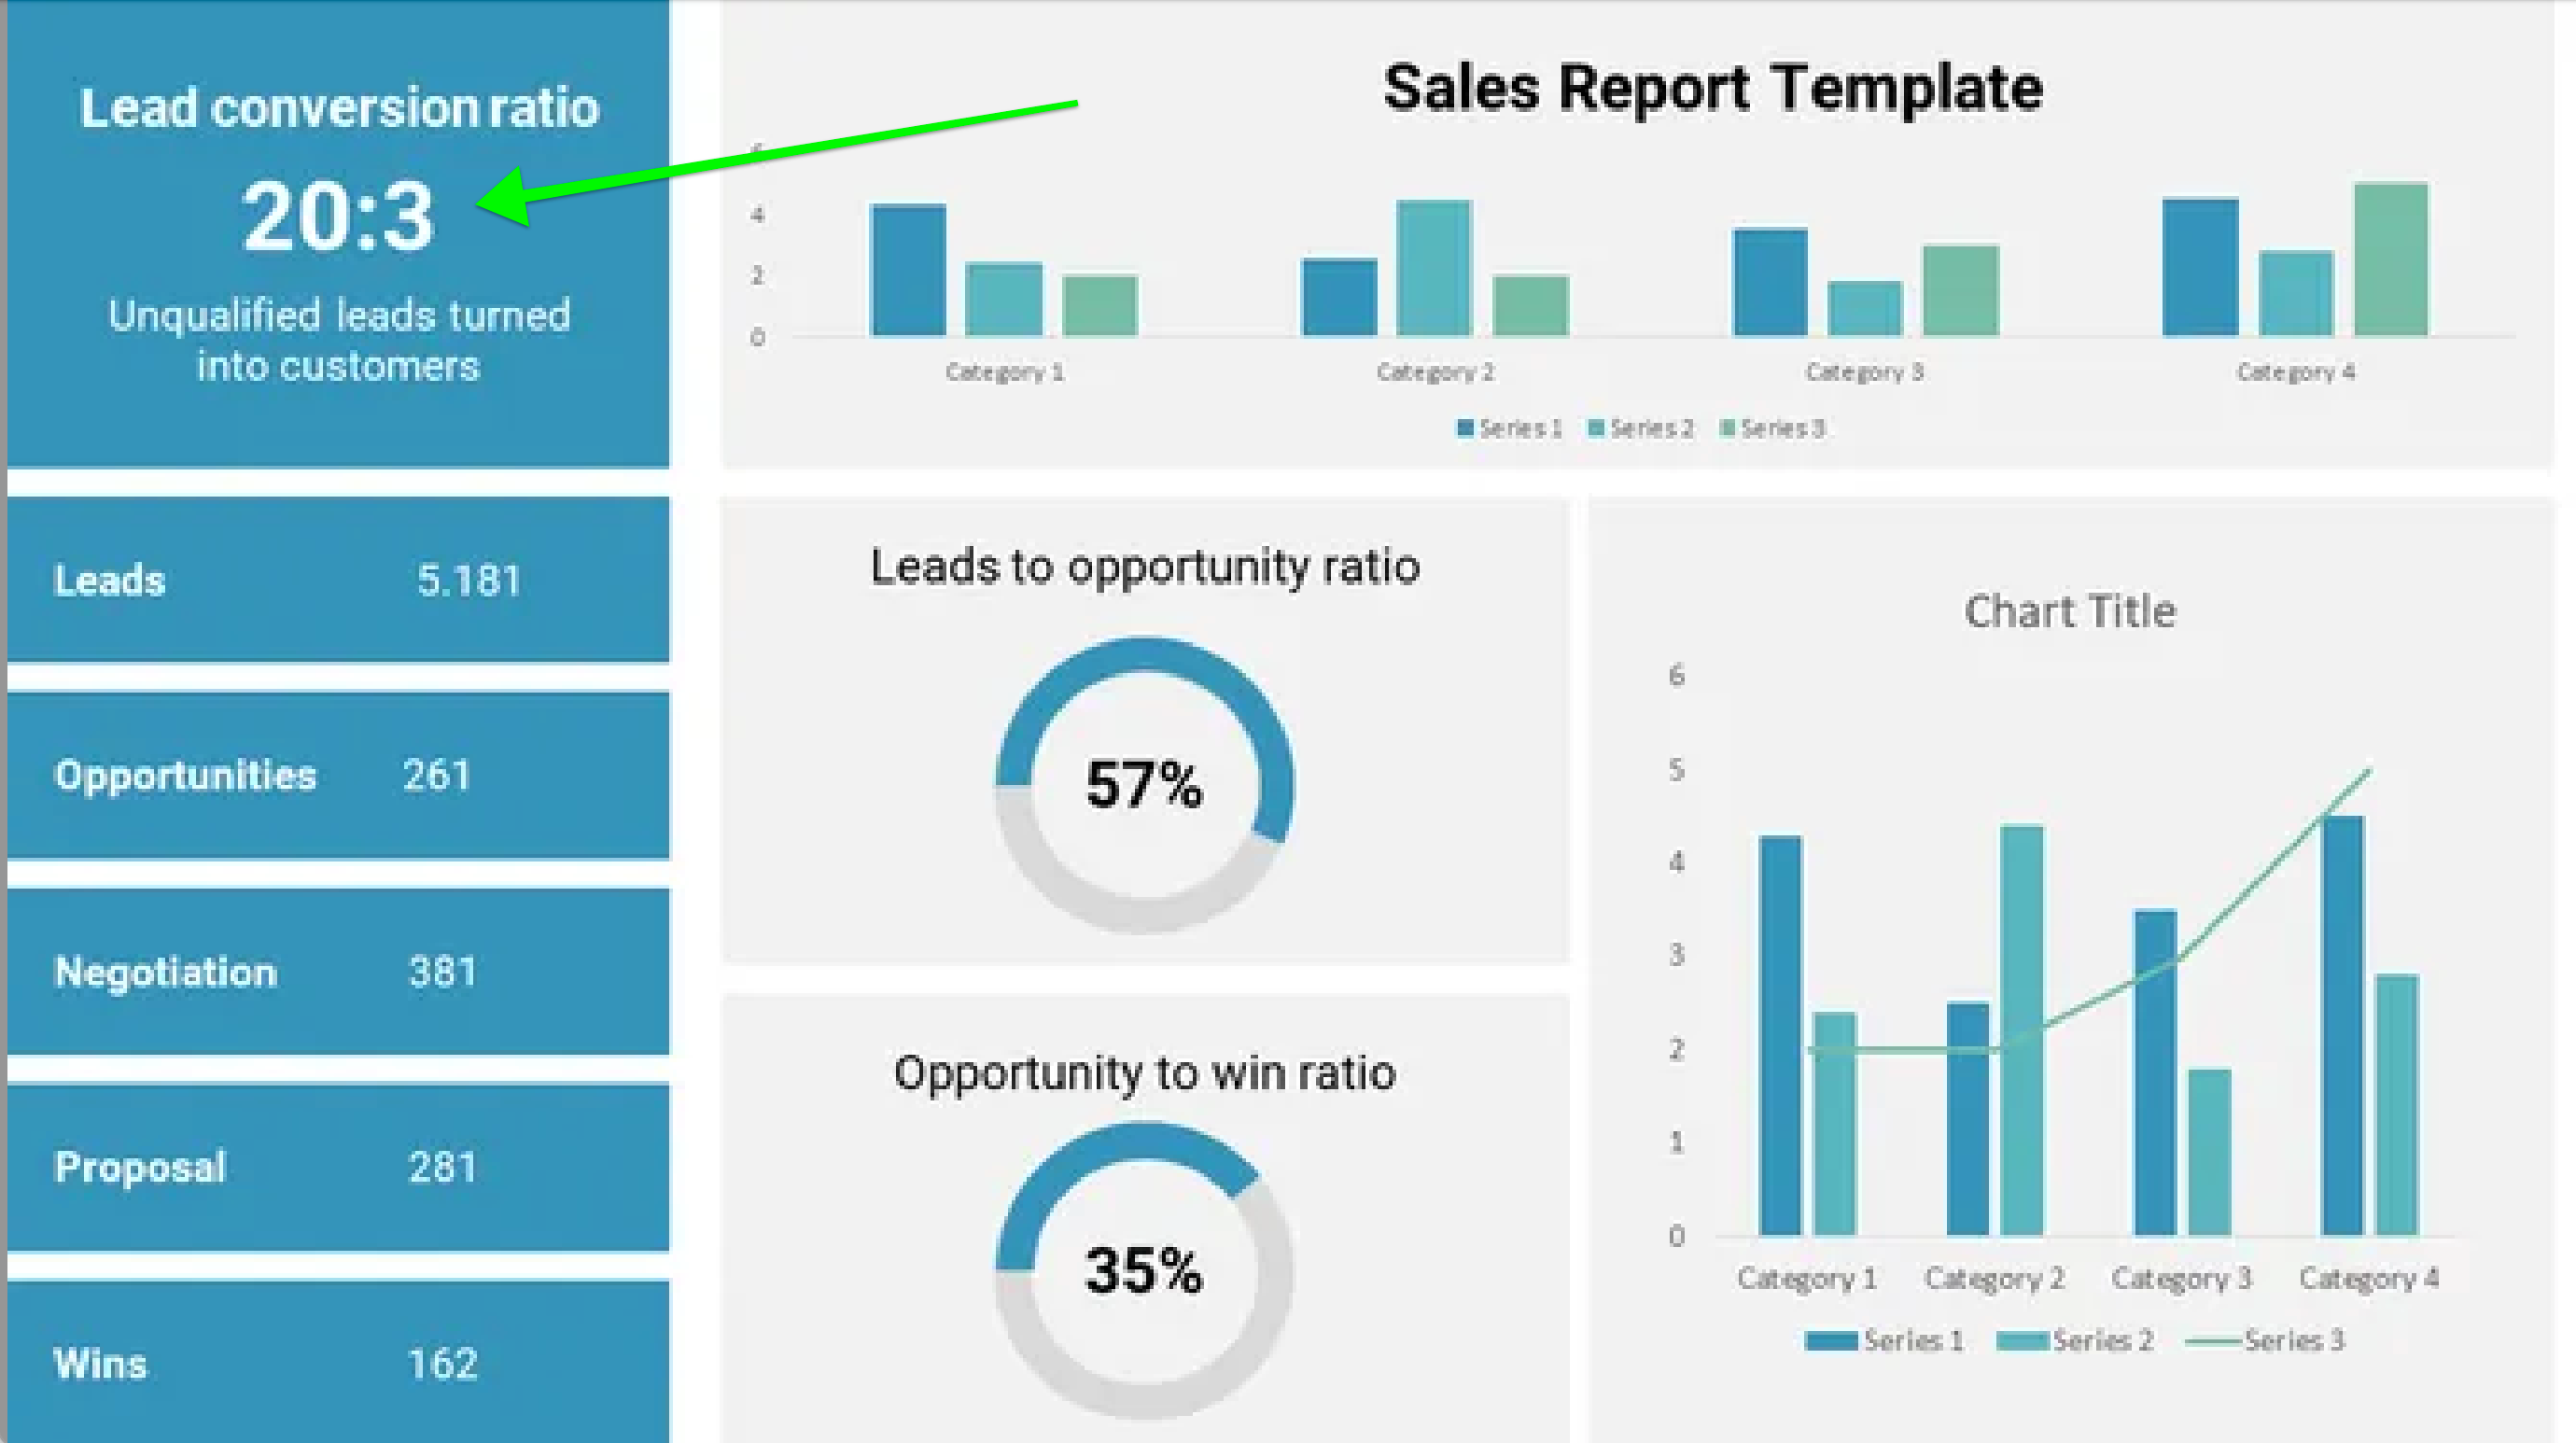
-
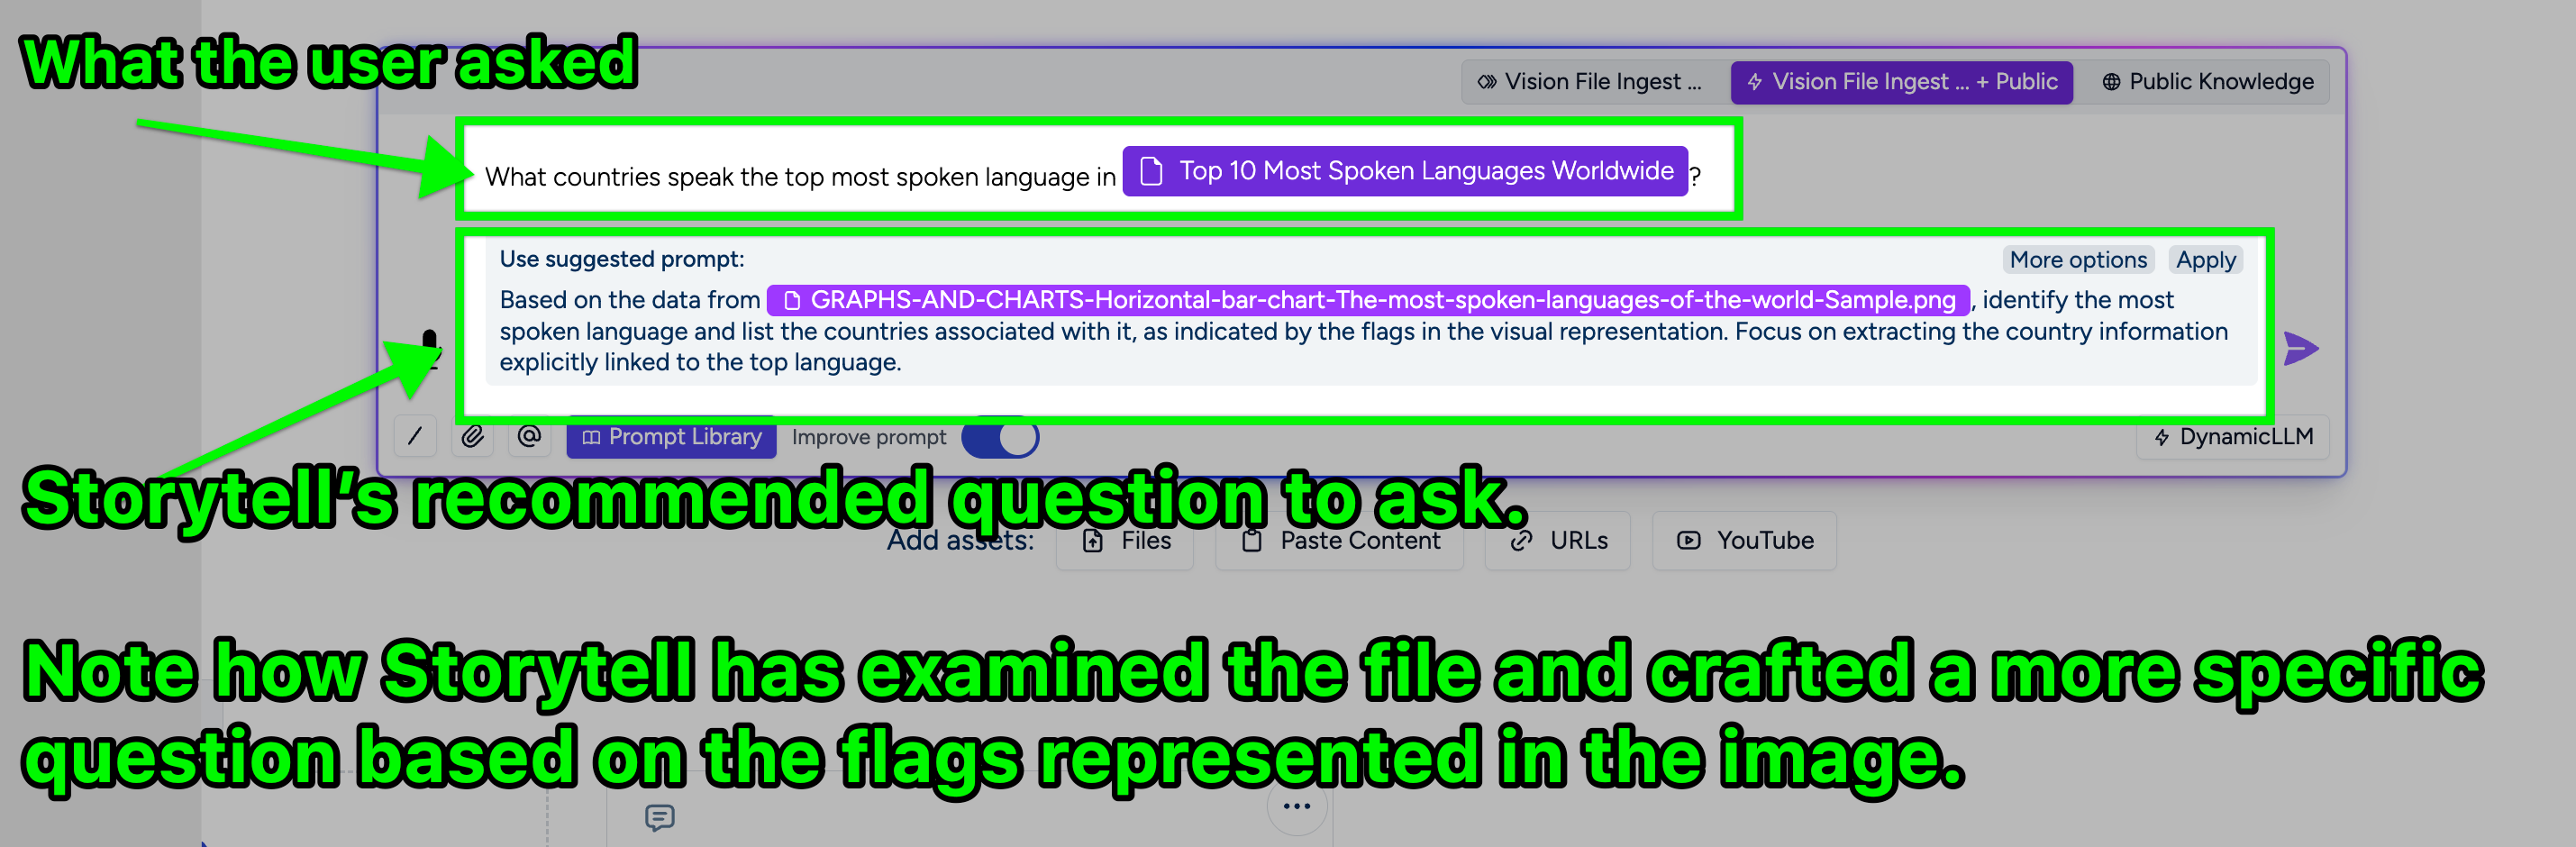
Interpreting Infographics: Vision Ingest excels at understanding complex visuals like infographics. For instance, if you submit an image like the chart below, which displays languages and associated country flags: